Biologist

The Birds and the Bees of Leatherbacks

Colburtle Leatherback Turtle

When I was writing up the last post on the Great Turtle Race, I came across this Wikipedia page that has details on every Colbert report ever (what doesn’t Wikipedia have?). It included this quote on Stephen Colbert’s leatherback:

Stephen is unhappy at the fact that Stephanie Colburtle The Turtle did not win The Great Turtle Race, after being bested by another turtle named Billy. He claims Billy is a male, and demands a re-race. (After explaining that one can tell the sex of a turtle by the concavity of its plastron, Stephen says that he checks the plastron on “all [his] dates, and if it’s not concave, [he is] outta there.” However, a concave plastron denotes a male turtle.)

Now I’m not totally sure the concave plastron bit works with leatherbacks since they’re more barrel-shaped than turtle-shaped but I guess it’s possible. But on the topic, I just thought I’d share a couple tips for determining leatherback sex.

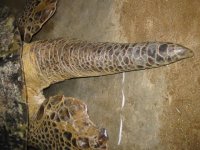
Male green turtle tail by Daha DIEW et Alain GIBUDI

First, is it on a beach? If so, it’s female. Healthy male leatherbacks never return to land after their initial crawl from the nest to the ocean. That makes research programs that catch turtles at sea the only way to look at male leatherbacks.

Second, does it have a long tail that trails well behind the shell? Then it’s a male. Leatherbacks (and other sea turtles) store their penis in their tail. The tails of female turtles barely extend past their shell. The tails of male turtles, shall we say, hang low and wobble to and fro. I couldn’t dig up a picture of a male leatherback but here’s a picture of a male green sea turtle tail (from seaturtle.org courtesy of Daha Diew and Alain Gibudi) that should give an idea (that’s its rear flippers in the left edge of the picture).

And now you know.

Biologist
Leatherback

Comments (1)

Permalink

Great Turtle Race

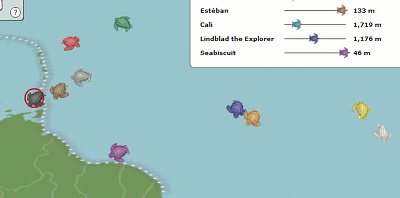
I’m a bit late on this one (I don’t know how I managed to miss it since I had to put the data together) but National Geographic and Conservation International had a Great Turtle Race with a bunch of leatherback turtles tagged by my old adviser. They took data from turtle tracked from Nova Scotia to South America and had a big two-week event watching which turtle reached the Caribbean first. They have a pretty cool animation of the satellite tracking (although of course not quite as good as mine) and some cute leatherback artwork (complete with leathery back instead of shell, although why are they green?).

Flash animation of Great Turtle Race Leatherback turtle game

That site also has the first leatherback game I’ve ever seen. The artist did a really good job since the view is pretty much identical to the view we get from a shoulder mounted turtleCam. Unfortunately, the game turtle handles like a tank which really doesn’t do justice to the maneuvering ability of leatherbacks. They’re huge animals but in the water they’re really quite graceful and they can turn on a dime (as I quickly found out when we were trying to catch them).

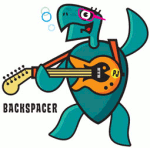
Backspacer leatherback by Chris Rooney

Anyway, it looks like the turtle named Backspacer (it’s weird to see all the interesting names since we always call the turtles by their tag ID number), sponsored by Pearl Jam, yes that Pearl Jam, won the race. Turtle Cali won the diving portion of the race and received an Iron Turtle Award. Here’s a nice post-race summary and also Olympic swimmer (and turtle coach) Jason Lezak’s take on it. It’s great to see so much public interest in leatherback turtle tracking and National Geographic and Conservation International did a great job promoting and running the event.

Biologist
Leatherback

Comments (1)

Permalink

Counting Q20 Bases in a .qual File

I sometimes get asked to count the number of bases with qualities greater than or equal to 20 in a quality file. I’m not entirely sure this is all that good a metric with 454 sequencing but that’s another story. It always takes me a minute or two to come up with the right Unix commands to do it so I’m going to post it here so I remember (and maybe save someone else a couple minutes).

cat *qual|grep '^[^>]'|sed 's/ /\n/g'|grep -c [234][0-9]

This is very quick and dirty (just removing lines starting with “>”, replacing spaces with newlines and counting the resulting lines with quals 20-40) but it seems to work ok for me. Also yes I know it’s stupid to cat to a grep but I often replace the cat with head for testing. And I’m sure you could do it in a single awk or sed step but it gets done in a minute or two for several hundred million bases so I haven’t really been motivated to change it.

Bash/UNIX
Bioinformatics
Biologist
Programmer

Comments (1)

Permalink

Converting Between Gapped and NonGapped DNA Coordinates in R

I’ve been needing to convert coordinates in gapped DNA alignments back and forth to coordinates in the nongapped sequence a lot recently. For example, the T in AC–TGA–A is in the 5th position but in the gapless sequence ACTGAA it is 3rd. My first few tries (counting chars in regex’d substrings) at programming up a decent converters ended up not working very well with large datasets. Since I had to do it with 50,000 positions in a sequence with 2 million letters, I was running into a little trouble. But it ended up actually being a pretty easy problem in R so I thought I’d post it up in case anybody else is running into something similar. Also it’s a pretty good example why programming in R can be fun.

[R] gap2NoGapSo the function takes a gapped sequence and the gapped coordinates. It splits the gapped sequence into an array of single characters and finds which ones are not -‘s. It then takes the cumulative sum at each element in the array (TRUE evaluates as 1 and FALSE as 0). This gives an array where each element gives the new gap-free coordinates. So the function just returns the appropriate new coordinate for each old coordinate. [R] noGap2GapThis opposite conversion function again takes the gapped sequence and appropriately the nongapped coordinates. It splits the gapped sequence into an array of single characters and finds the indices of the characters which are not -‘s. Since we only stored the indices of nongap characters, this array gives the gapped coordinates for each nongap letter. So again the function can just returns the appropriate new coordinate for each old coordinate.

These ended up being pretty elegant in R (once I finally figured them out).

Bioinformatics
Biologist
Programmer
R

Comments (3)

Permalink

Functional Metagenomics: Sequence Everything and Let DNA Sort The Functions Out

ResearchBlogging.org

One of the cool things you can do with the high throughput DNA analysis of pyrosequencing, is to collect a sample from the environment, isolate the DNA from everything in it and sequence it. Then you can match the DNA up with known sequences and see what sort of microbes you had. Dinsdale and a bunch of coauthors collected the data from a bunch of such studies. They managed to find 45 bacterial samples and 42 viral samples from 9 broad environmental classifications. You can see all the different samples the authors pooled together (circles microbial and squares viral).
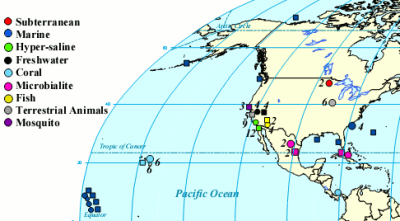
Locations of metagenomic samples from Dinsdale et al.

The interesting thing about this study was that instead of looking at the taxonomy of the critters as usual, they looked at the function of the genes. By simply looking at what the genes do, the researchers hoped to get a feel for what activities were going on in that environment without necessarily having to identify the species of the bacteria and viruses. To do this, they fed their 14.5 million sequences (pyrosequencing sure can generate data) into the SEED database, a big collection of genes which have been assigned to functions (for example membrane transport or sulphur metabolism) by experts. They were able to match 1 million of the bacterial and 500,000 of the viral sequences to previously identified gene functions.

It might seem odd that they would look at viral DNA since viruses are rather simple and have only a few basic genes. But the researchers were actually looking at bacterial genetic sequences being carried inside viruses. This of course brings up the question of what bacterial DNA is doing inside viruses. It turns out there are a lot of bacteriophage viruses that like to infect bacteria and sometimes these viruses capture some of the DNA of their bacterial hosts and carry it to their next host. Looking at the bacterial DNA present in a viral population gives an interesting look at what types of genes are being passed around between individual bacteria (and even between bacterial species).

So here are the high level classifications of the function of the genes they found for each environment.
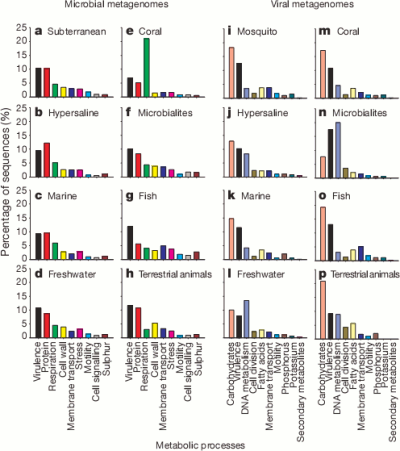
Percentages of gene function of bacterial and viral gene function from Dinsdale et al.

It’s pretty cool that the viruses were carrying around so much of a variety of bacterial DNA. The authors suggest that motility genes coding for things like flagella and cilia (which could help the bacterial host spread the virus further) were enriched in the viral samples but it seems a bit hard to say that for certain without a bit more analysis.

A useful way to look at huge masses of data, like their 1.5 million matches, is to try and reduce all the different counts in the functional categories into a couple of condensed variables. This can be seen in the next couple plots. They could use a little explaining. Bacterial sequences are on top and viral sequences on the bottom. Lines show how the various functional categories have been condensed into the x and y variables. For example, samples that contained lots of genes for making cell walls will tend to be at the top of the plot in the bacterial samples and tend not to have many genes for respiration.
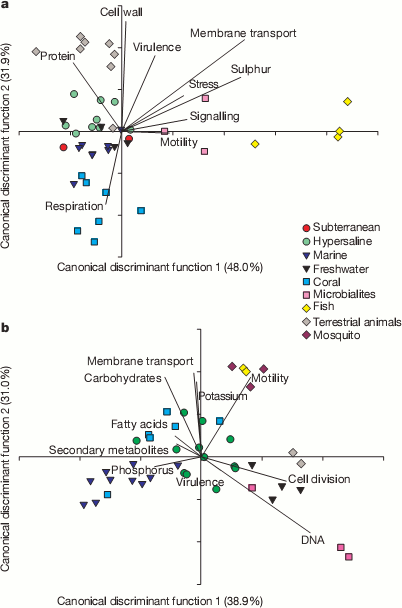
Canonical discriminant function analysis of bacterial and viral gene function from Dinsdale et al.

It’s pretty cool to see how the various environments clustered with other samples from the same environment. For example, all the yellow diamond fish farm samples ended up on the right side of the bacteria graphs even though they were sampled independently. It appears that functions seem to correlate with environmental conditions. For example, the fish food at the fish farms contained a lot of sulfur supplements and the bacteria from those samples were rich in sulfur metabolism genes and the bacteria from corals contained many different respiration genes to deal with the highly variable oxygen concentrations found there. Dinsdale and her coauthors go so far as to suggest that gene function may provide a better indicator of environment than the taxonomy of the bacteria present.

The paper did have a little trouble in the math in one part but the authors already have a correction in for it so it’s really not worth worrying about. Overall, it was a pretty interesting story and a good example of stuff to do with a sequencing machine (also it must have taken a good bit of work to collect all that data together from all those authors).

References

Elizabeth A. Dinsdale, Robert A. Edwards, Dana Hall, Florent Angly, Mya Breitbart, Jennifer M. Brulc, Mike Furlan, Christelle Desnues, Matthew Haynes, Linlin Li, Lauren McDaniel, Mary Ann Moran, Karen E. Nelson, Christina Nilsson, Robert Olson, John Paul, Beltran Rodriguez Brito, Yijun Ruan, Brandon K. Swan, Rick Stevens, David L. Valentine, Rebecca Vega Thurber, Linda Wegley, Bryan A. White, Forest Rohwer (2008). Functional metagenomic profiling of nine biomes Nature, 452 (7187), 629-632 DOI: 10.1038/nature06810

Biologist
Statistician

Comments (1)

Permalink