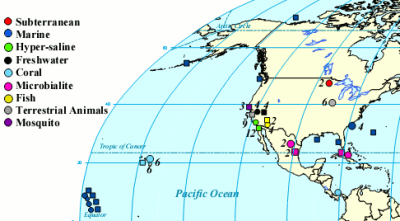
One of the cool things you can do with the high throughput DNA analysis of pyrosequencing, is to collect a sample from the environment, isolate the DNA from everything in it and sequence it. Then you can match the DNA up with known sequences and see what sort of microbes you had. Dinsdale and a bunch of coauthors collected the data from a bunch of such studies. They managed to find 45 bacterial samples and 42 viral samples from 9 broad environmental classifications. You can see all the different samples the authors pooled together (circles microbial and squares viral).

The interesting thing about this study was that instead of looking at the taxonomy of the critters as usual, they looked at the function of the genes. By simply looking at what the genes do, the researchers hoped to get a feel for what activities were going on in that environment without necessarily having to identify the species of the bacteria and viruses. To do this, they fed their 14.5 million sequences (pyrosequencing sure can generate data) into the SEED database, a big collection of genes which have been assigned to functions (for example membrane transport or sulphur metabolism) by experts. They were able to match 1 million of the bacterial and 500,000 of the viral sequences to previously identified gene functions.
It might seem odd that they would look at viral DNA since viruses are rather simple and have only a few basic genes. But the researchers were actually looking at bacterial genetic sequences being carried inside viruses. This of course brings up the question of what bacterial DNA is doing inside viruses. It turns out there are a lot of bacteriophage viruses that like to infect bacteria and sometimes these viruses capture some of the DNA of their bacterial hosts and carry it to their next host. Looking at the bacterial DNA present in a viral population gives an interesting look at what types of genes are being passed around between individual bacteria (and even between bacterial species).
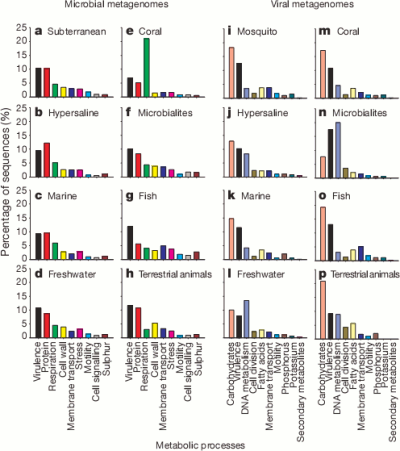
So here are the high level classifications of the function of the genes they found for each environment.

It’s pretty cool that the viruses were carrying around so much of a variety of bacterial DNA. The authors suggest that motility genes coding for things like flagella and cilia (which could help the bacterial host spread the virus further) were enriched in the viral samples but it seems a bit hard to say that for certain without a bit more analysis.
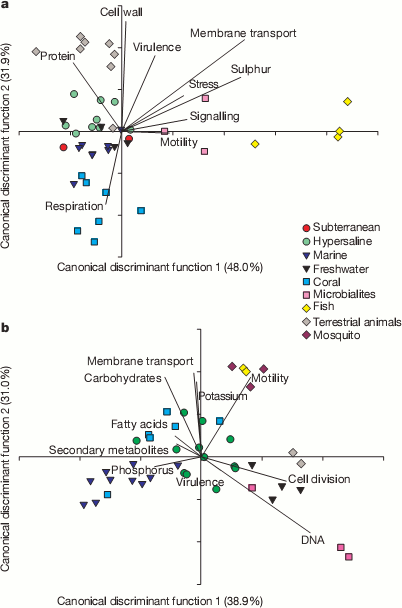
A useful way to look at huge masses of data, like their 1.5 million matches, is to try and reduce all the different counts in the functional categories into a couple of condensed variables. This can be seen in the next couple plots. They could use a little explaining. Bacterial sequences are on top and viral sequences on the bottom. Lines show how the various functional categories have been condensed into the x and y variables. For example, samples that contained lots of genes for making cell walls will tend to be at the top of the plot in the bacterial samples and tend not to have many genes for respiration.

It’s pretty cool to see how the various environments clustered with other samples from the same environment. For example, all the yellow diamond fish farm samples ended up on the right side of the bacteria graphs even though they were sampled independently. It appears that functions seem to correlate with environmental conditions. For example, the fish food at the fish farms contained a lot of sulfur supplements and the bacteria from those samples were rich in sulfur metabolism genes and the bacteria from corals contained many different respiration genes to deal with the highly variable oxygen concentrations found there. Dinsdale and her coauthors go so far as to suggest that gene function may provide a better indicator of environment than the taxonomy of the bacteria present.
The paper did have a little trouble in the math in one part but the authors already have a correction in for it so it’s really not worth worrying about. Overall, it was a pretty interesting story and a good example of stuff to do with a sequencing machine (also it must have taken a good bit of work to collect all that data together from all those authors).
References
Elizabeth A. Dinsdale, Robert A. Edwards, Dana Hall, Florent Angly, Mya Breitbart, Jennifer M. Brulc, Mike Furlan, Christelle Desnues, Matthew Haynes, Linlin Li, Lauren McDaniel, Mary Ann Moran, Karen E. Nelson, Christina Nilsson, Robert Olson, John Paul, Beltran Rodriguez Brito, Yijun Ruan, Brandon K. Swan, Rick Stevens, David L. Valentine, Rebecca Vega Thurber, Linda Wegley, Bryan A. White, Forest Rohwer (2008). Functional metagenomic profiling of nine biomes Nature, 452 (7187), 629-632 DOI: 10.1038/nature06810
bhimanibhumika | 31-Jan-11 at 1:22 am | Permalink
please send ready project of metagenomics